In This Article:
LQDA
Sponsored
The YUTREPIA Money Printer: Why Liquidia's 25% Breakout is Just the First Inning
BullishStrongChange from report: +18.2%1M: +25.9%3M: +39.2%
Published on 2026-05-12 by TradeFomo
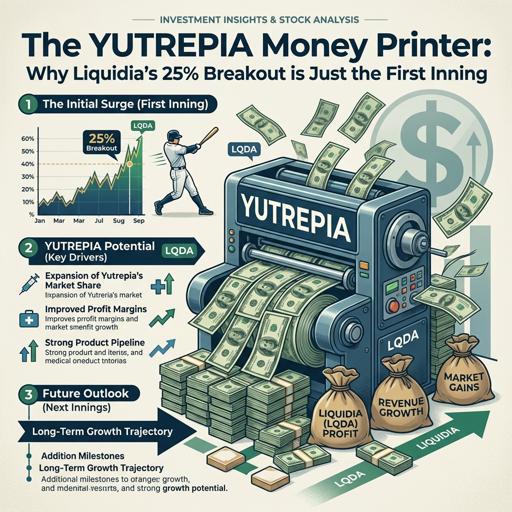
Most retail investors and algorithmic momentum traders see a 25.6% single-day spike and assume the trade is over. They see Liquidia (LQDA) hitting a multi-year high of $53.93 on May 11, 2026, and their immediate instinct is to claim that all the upside from the Q1 earnings report is already priced in. This is a fundamental misreading of both the business cycle and the tape. What the crowd sees as a climax is actually a massive structural repricing.
The Fundamental Disconnect: A Biotech Crossing the Chasm
Liquidia is no longer a speculative clinical-stage biotech burning cash to survive. With the latest Q1 2026 print, it has officially transformed into a cash-minting machine. We are looking at a company that posted $129.9 million in net product sales for YUTREPIA in a single quarter—a blistering 44% sequential increase from Q4 2025. This generated a massive $52.9 million in net income and $71.2 million in adjusted EBITDA.
The market capitalization sits at roughly $4.6 billion, which might seem rich to a novice screener until you realize the annualized run rate of this revenue growth puts them at a forward valuation that deep-value investors should be aggressively accumulating. The commercial execution is flawless: over 4,500 unique patient prescriptions since the June 2025 launch. The inflection point has been crossed, and the fundamental risk profile of the company has been permanently altered.
Unmasking the Dark Pool Tape: The Institutional Frenzy
To truly understand the institutional money flow, we must systematically analyze the linkage between four pivotal indicators: the off-exchange volume ratio, the off-exchange short selling percentage, the volume Z-score, and the rolling close location value. When viewed together, these four indicators can reveal institutions' hidden off-exchange shorting or long accumulation behaviors, flag abnormal fund flows, and highlight crucial volume-price divergences. Crucially, if the off-exchange volume ratio and the volume Z-score hit recent extremes on the same exact day—as they just did—it generally indicates that a new trend is about to start. Meanwhile, the trend in the rolling close location value reflects the change in closing bullish and bearish power. Combining these metrics with Liquidia's most recent price action yields a comprehensive judgment. On May 11, the volume Z-score erupted to an astronomical 6.10, coinciding with the off-exchange volume ratio skyrocketing to the 96.7th percentile. Instead of heavy shorting, the off-exchange short selling percentage was suppressed down in the 35th percentile. Concurrently, the rolling close location value surged to 0.766, with the daily close location value maxing out at an iron-clad 0.944. This combination provides a definitive reading: institutions are aggressively routing buy orders through off-exchange facilities to hide their footprints and absorb liquidity without moving the lit markets prematurely. They are locking in shares at the highs of the day without any appetite for shorting. This is textbook stealth accumulation, confirming the recent 25% price spike is not a climax, but the violent ignition of a new upward trend.
Trapped Bears and The Options Panic
Before this earnings blowout, the bears were dangerously complacent. As of mid-April 2026, the short interest stood at a towering 11.4 million shares—over 17% of the float. These short sellers were betting heavily on a stall in YUTREPIA's adoption curve. Instead, they got run over by a freight train of profitability.
Look at the options market from May 11th. Total option volume exploded to nearly 30,800 contracts. More importantly, the put-call volume ratio crashed to a staggering 0.25. This wasn't cautious hedging; this was an absolute panic grab for upside exposure. A put-call ratio this heavily skewed to calls on a day when the stock gaps up 25% means market makers are now short gamma. As the stock pushes higher, dealers will be forced to dynamically hedge by buying the underlying stock, creating a brutal feedback loop that will squeeze the trapped 17% short float out of their positions.
The Insider "Selling" Illusion
If you scan the surface-level SEC filings, you might see recent Form 4s from Chief Commercial Officer Scott Moomaw, Chief Medical Officer Rajeev Saggar, and General Counsel Russell Schundler showing stock sales in March and April. The uninitiated will immediately cry that "insiders are dumping."
Read the footnotes. These executives are acquiring massive blocks of stock through Performance Stock Unit (PSU) and Restricted Stock Unit (RSU) vestings. The subsequent "sales" are purely mechanical, automated transactions executed under Rule 10b5-1 plans solely to cover the tax obligations associated with those vestings. They aren't running for the exits; they are retaining the vast majority of their vested shares and cementing their ownership in a highly profitable enterprise.
The Final Verdict
Liquidia is currently exhibiting the rarest of market setups: flawless fundamental execution colliding with heavily offside bearish positioning. The off-exchange metrics and options data mathematically prove that smart money is quietly hoarding the float, completely ignoring the retail perception of the stock being technically "overbought." Do not fight this tape. The shorts are trapped, the institutions are buying in the dark, and the company is printing cash. The breakout is just getting started.
Sponsored